Solar bus proposal
Would adding solar panels to the roof of an electric bus really add range or save costs? I prepared a data-driven estimate for the energy gains to answer this question. In addition, to flesh out a what-if scenario, I designed a custom air conditioning packaging to maximise rooftop area for solar panels.
Stage 1 – Estimating solar panel energy generation
Nexport’s commercial team was keen to explore solar panels as a value-add option for our buses. Some initial numbers shared for its potential appeared unrealistically high. I deemed it unrealistic a bus roof alone could generate “over 100 kWh (kilowatthour) per day.” If true, that would be nearly 40% of typical daily consumption for a city bus and indeed a massive saving. So I set out to establish a more thorough estimate, using a very clear process for how I’d get those numbers.
My self-formulated brief:
Establish a realistic estimate for daily energy generation of rooftop solar panels on a bus, including Return on Investment (ROI) to build a business case.
Iteration 1 - Basic calculation
For the first iteration, I made three assumptions to get started:
- We can use the entire roof area of a bus (that is, we ignore aircon units and emergency escape hatches);
- Solar panels behave as if placed at a perfect angle (this allows us to use common efficiency figures for fixed installations);
- All energy generated can be fully utilised.
A simple calculation will give me an initial ballpark figure:
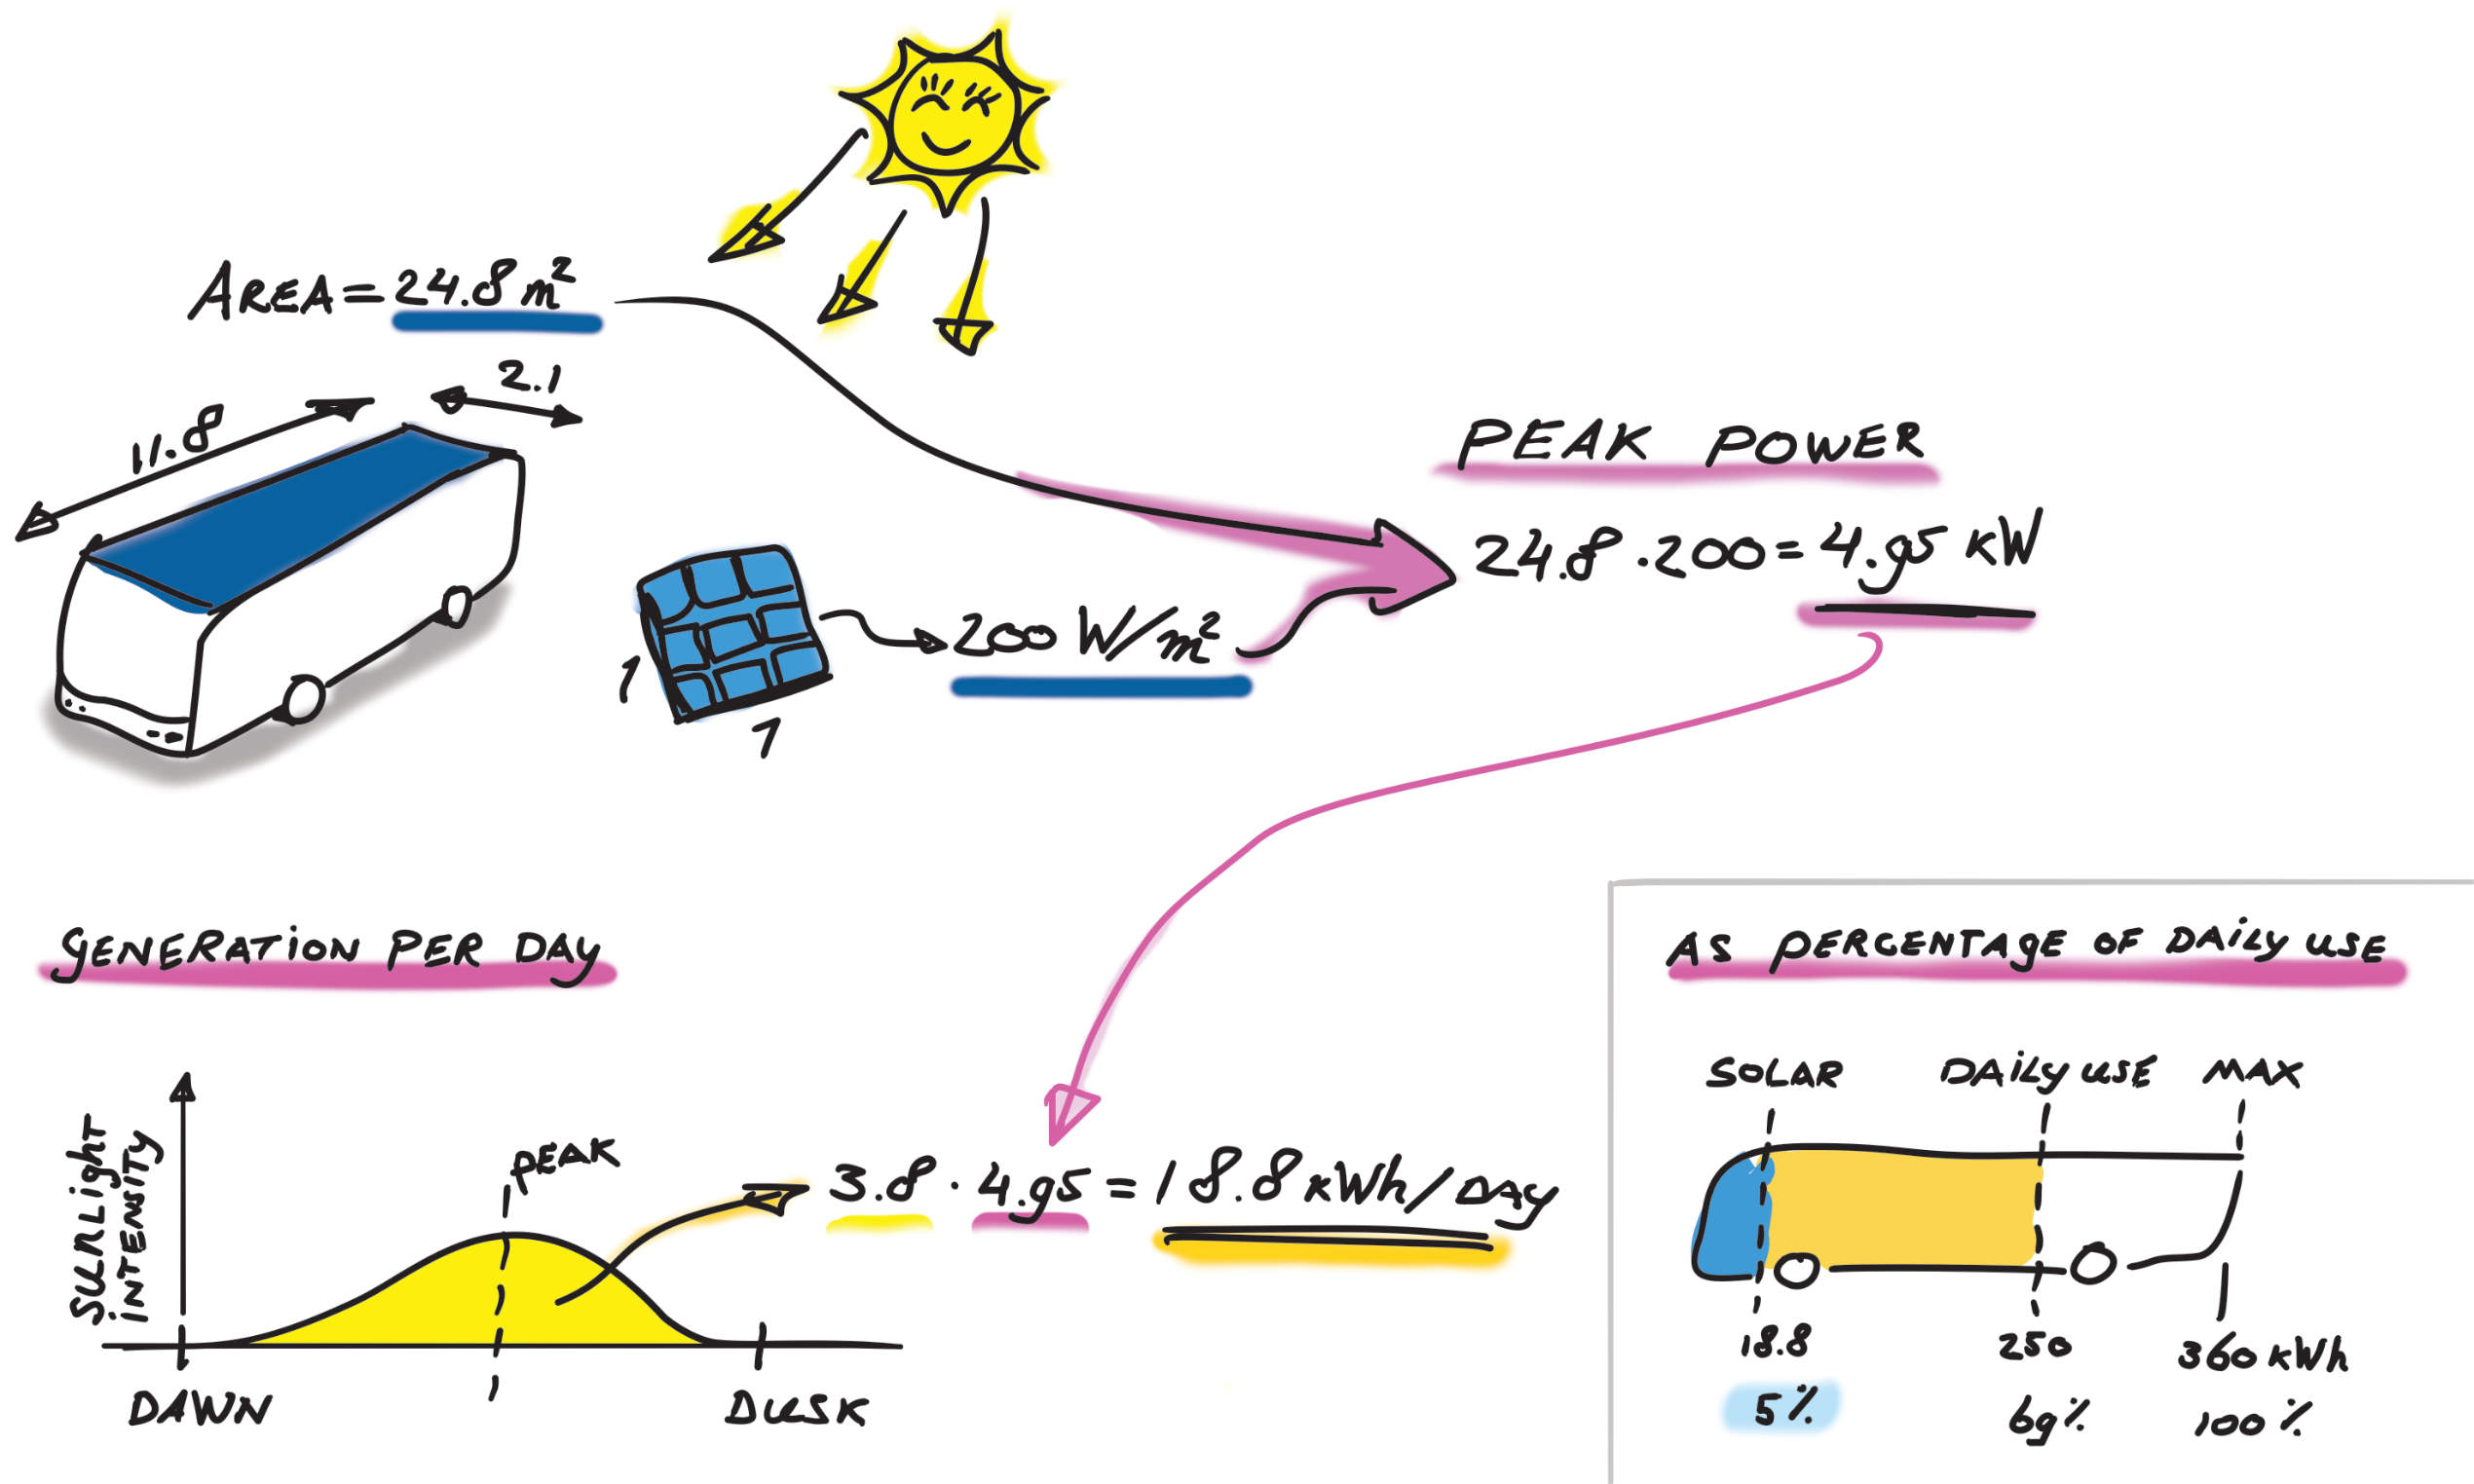
- Knowing our bus roof flat area is 2.1m wide and 11.8m long, we have a total area of 24.8 m2.
- Typical efficiency for a solar panel is around 20% or 200 W/m2 (assuming a nominal 1000 W/m2 of sunlight energy), so we get a total power generation of 4.95 kW;
- Across the whole day, we take a shortcut and multiply the power output by a factor of 3.8. Using this factor skips a more complex integration of sun position versus panel output at each time of the day.
- Final outcome is 18.8 kWh generated per day.
This figure of 18.8 kWh is an absolute best case scenario but already less than one fifth of the earlier number!
Iteration 2 - Refining assumptions and layout variations
I began by revisiting the assumptions given earlier:
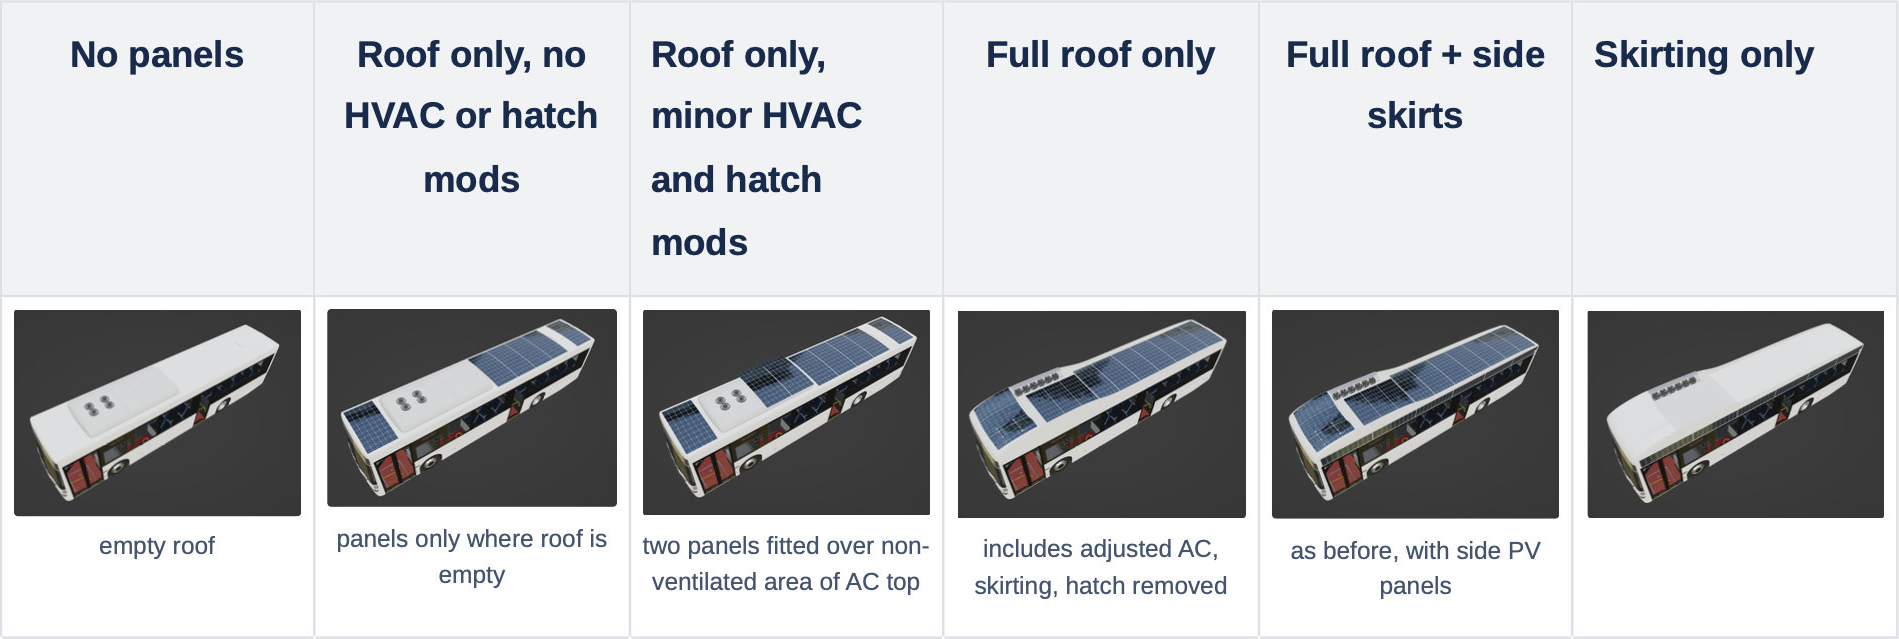
- I would include different configurations of solar panels, including configurations that no longer ignored existing rooftop elements.
- Also, I decided to only use existing solar panel components with known dimensions, using supplier data.
- The proponents of the 100 kWh/day figure raised that I forgot to add panels on the side of the bus, so I covered that option too.
- The angle relative to the sun should be considered when calculating a panel’s efficiency, so I get a better idea of the losses involved. I kept the kW-to-kWh/day factor to avoid complexity, in part because I lacked actual data on panel output versus angle versus sun intensity.
- System conversion losses (between panels and where energy is actually used on the vehicle) are still estimated, because proper modelling is too complex at this point. I still assume all energy can be utilised.
This time, I set up a spreadsheet to work through all calculations across various configurations. I also included cost estimates based on supplier info, with some assumptions and estimates for ongoing maintenance costs. Buses get lots of damage while on the road!
The max energy we can expect is now 14.9 kWh/day with roof and side panels fitted but at significantly worse ROI than a plain unmodded roof-only setup, which would yield 9.6 kWh/day. Based on this data, I concluded that (a) modifications to optimise solar panel quantity and placement were likely to yield worse ROI than a more restrained approach (resp. 153% vs 191% ROI over 20 years, generally poor figures with a break-even period of at least 8 years), and (b) final ROI figures are very dependant on ongoing maintenance costs. The slim margins could vanish if these costs proved higher in practice.
Reflection
Ultimately, the low ROI explains why rooftop solar on buses isn’t widespread. While it may be viable, the figures suggest that investing in a fixed installation at a bus depot is a safer investment.
I was happy with these outcomes relative to the time spent. It allowed us to assess likely outcomes and create a much clearer plan for how to proceed, if we were to investigate further. I effectively demonstrated a blueprint for how to approach similar innovation proposals, a significant process improvement for the Engineering team.
If I were to do another step, I would need to accurate model both panel performance and system performance to get a better idea of generated energy and how that energy may be utilised.
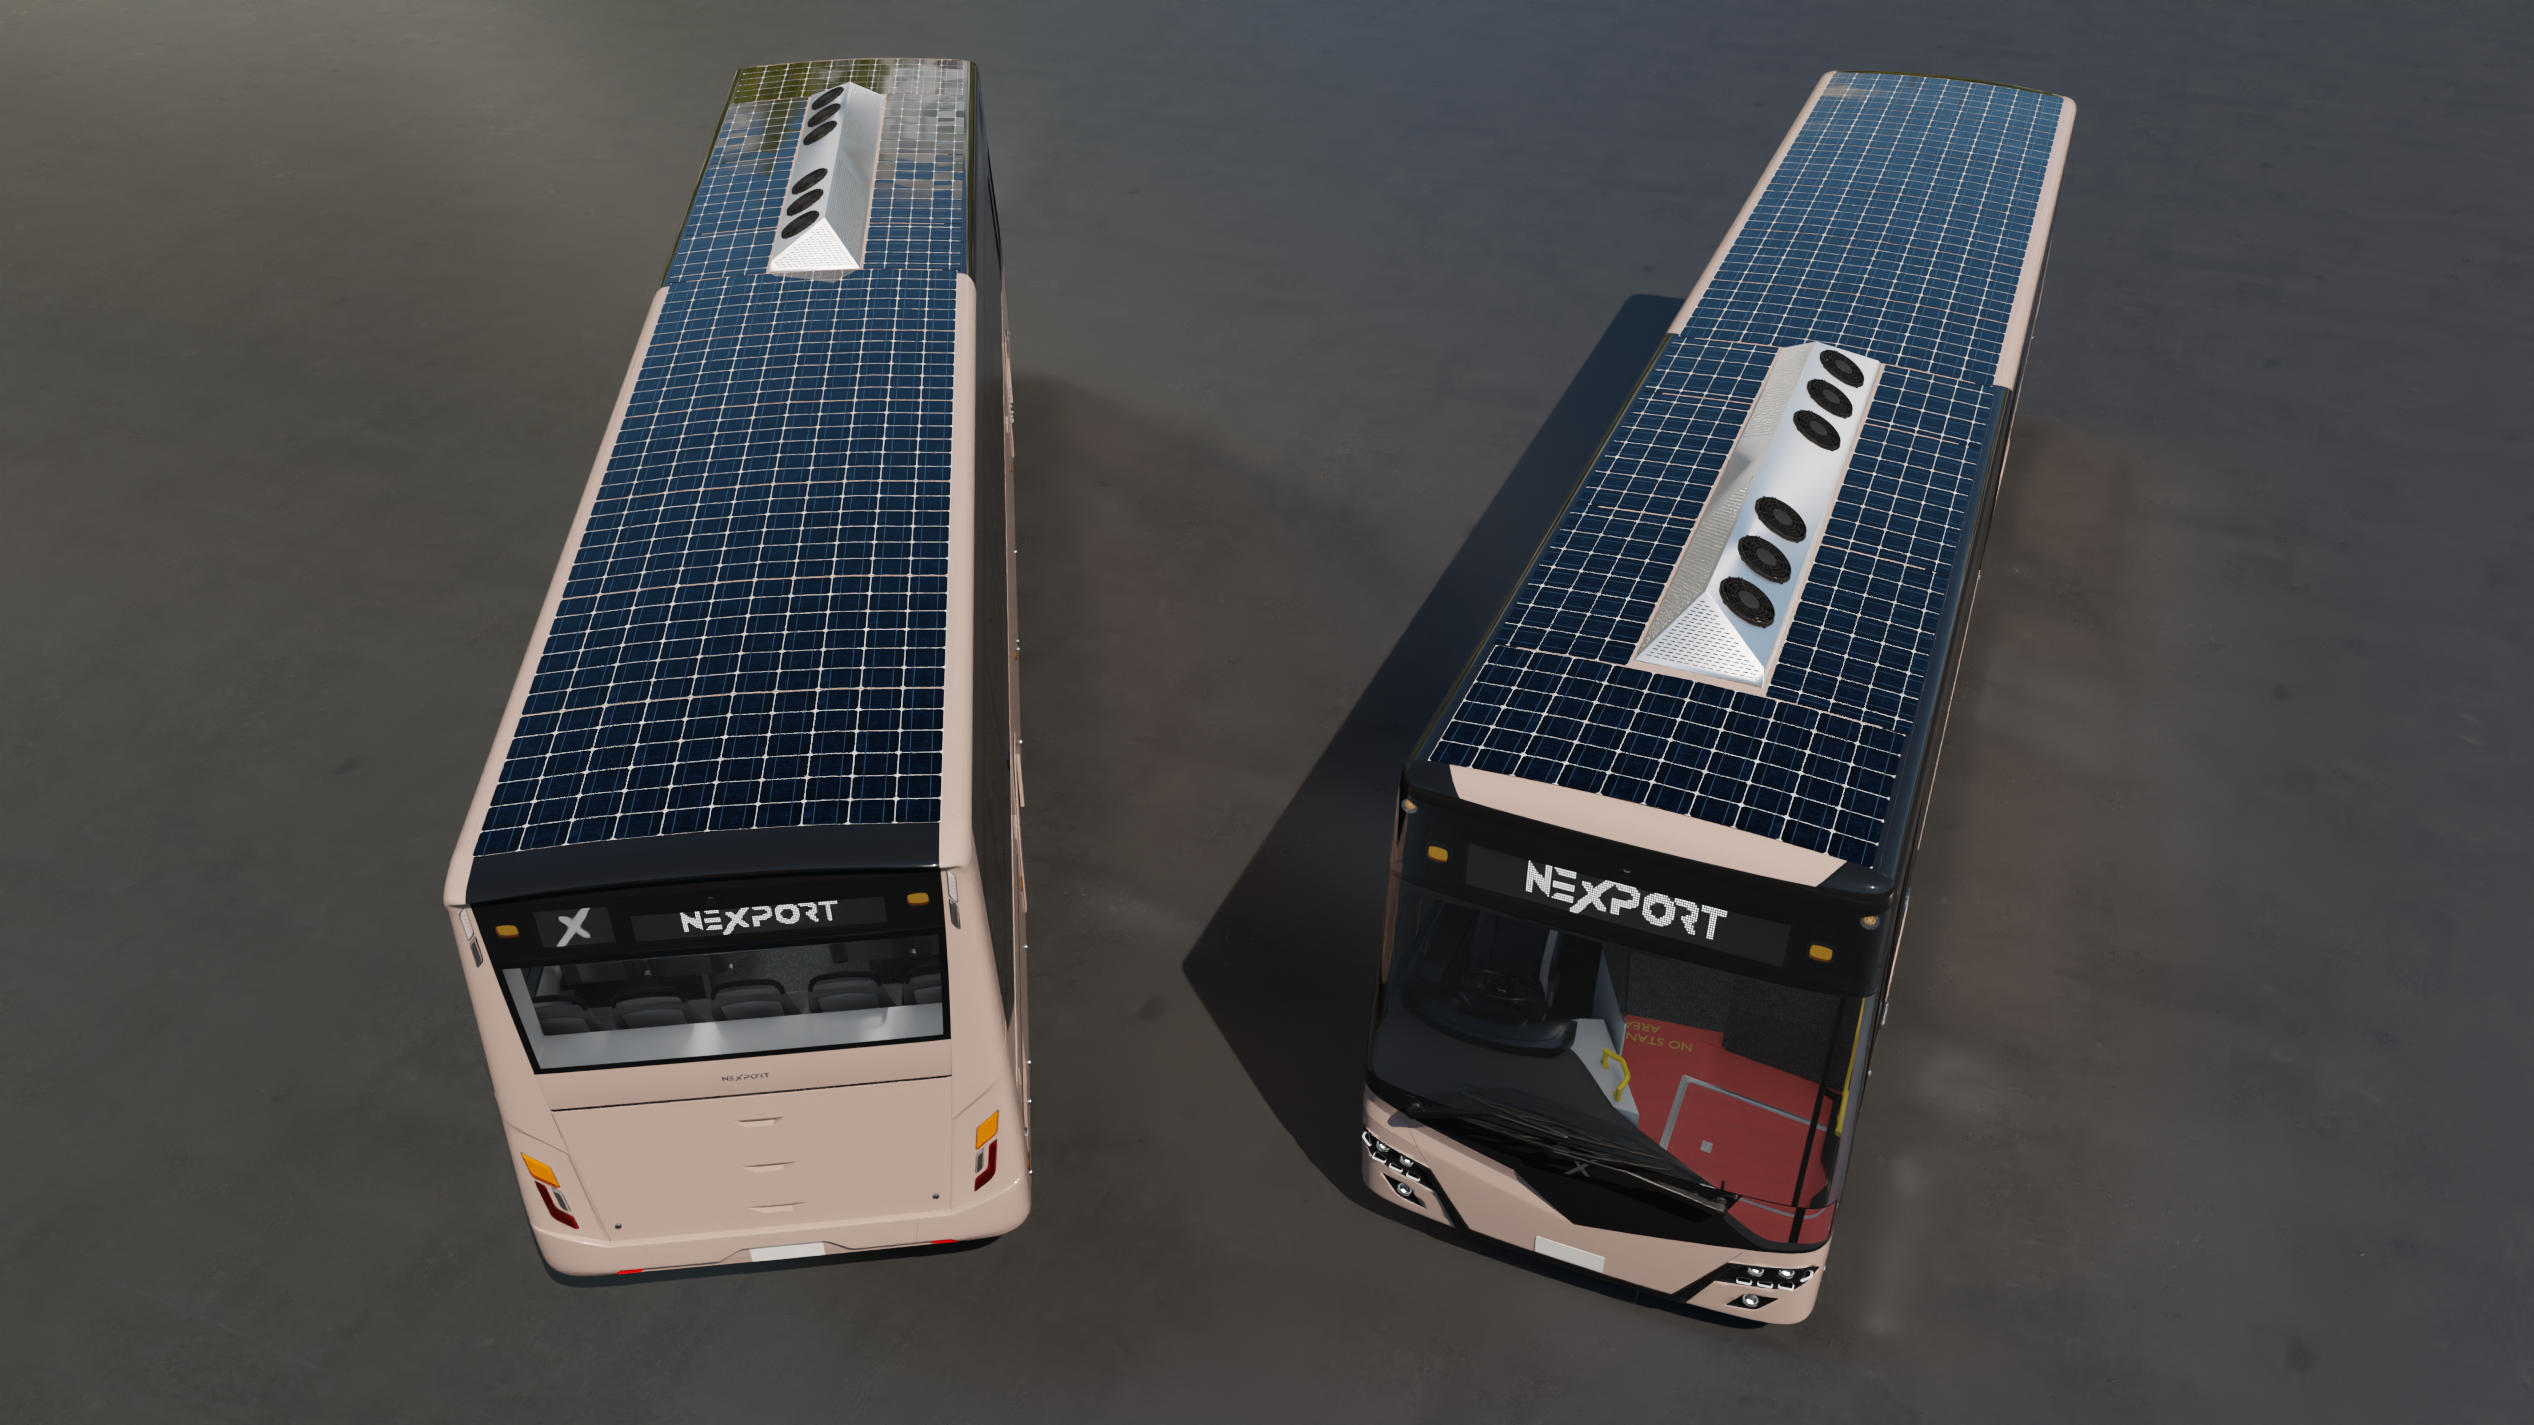
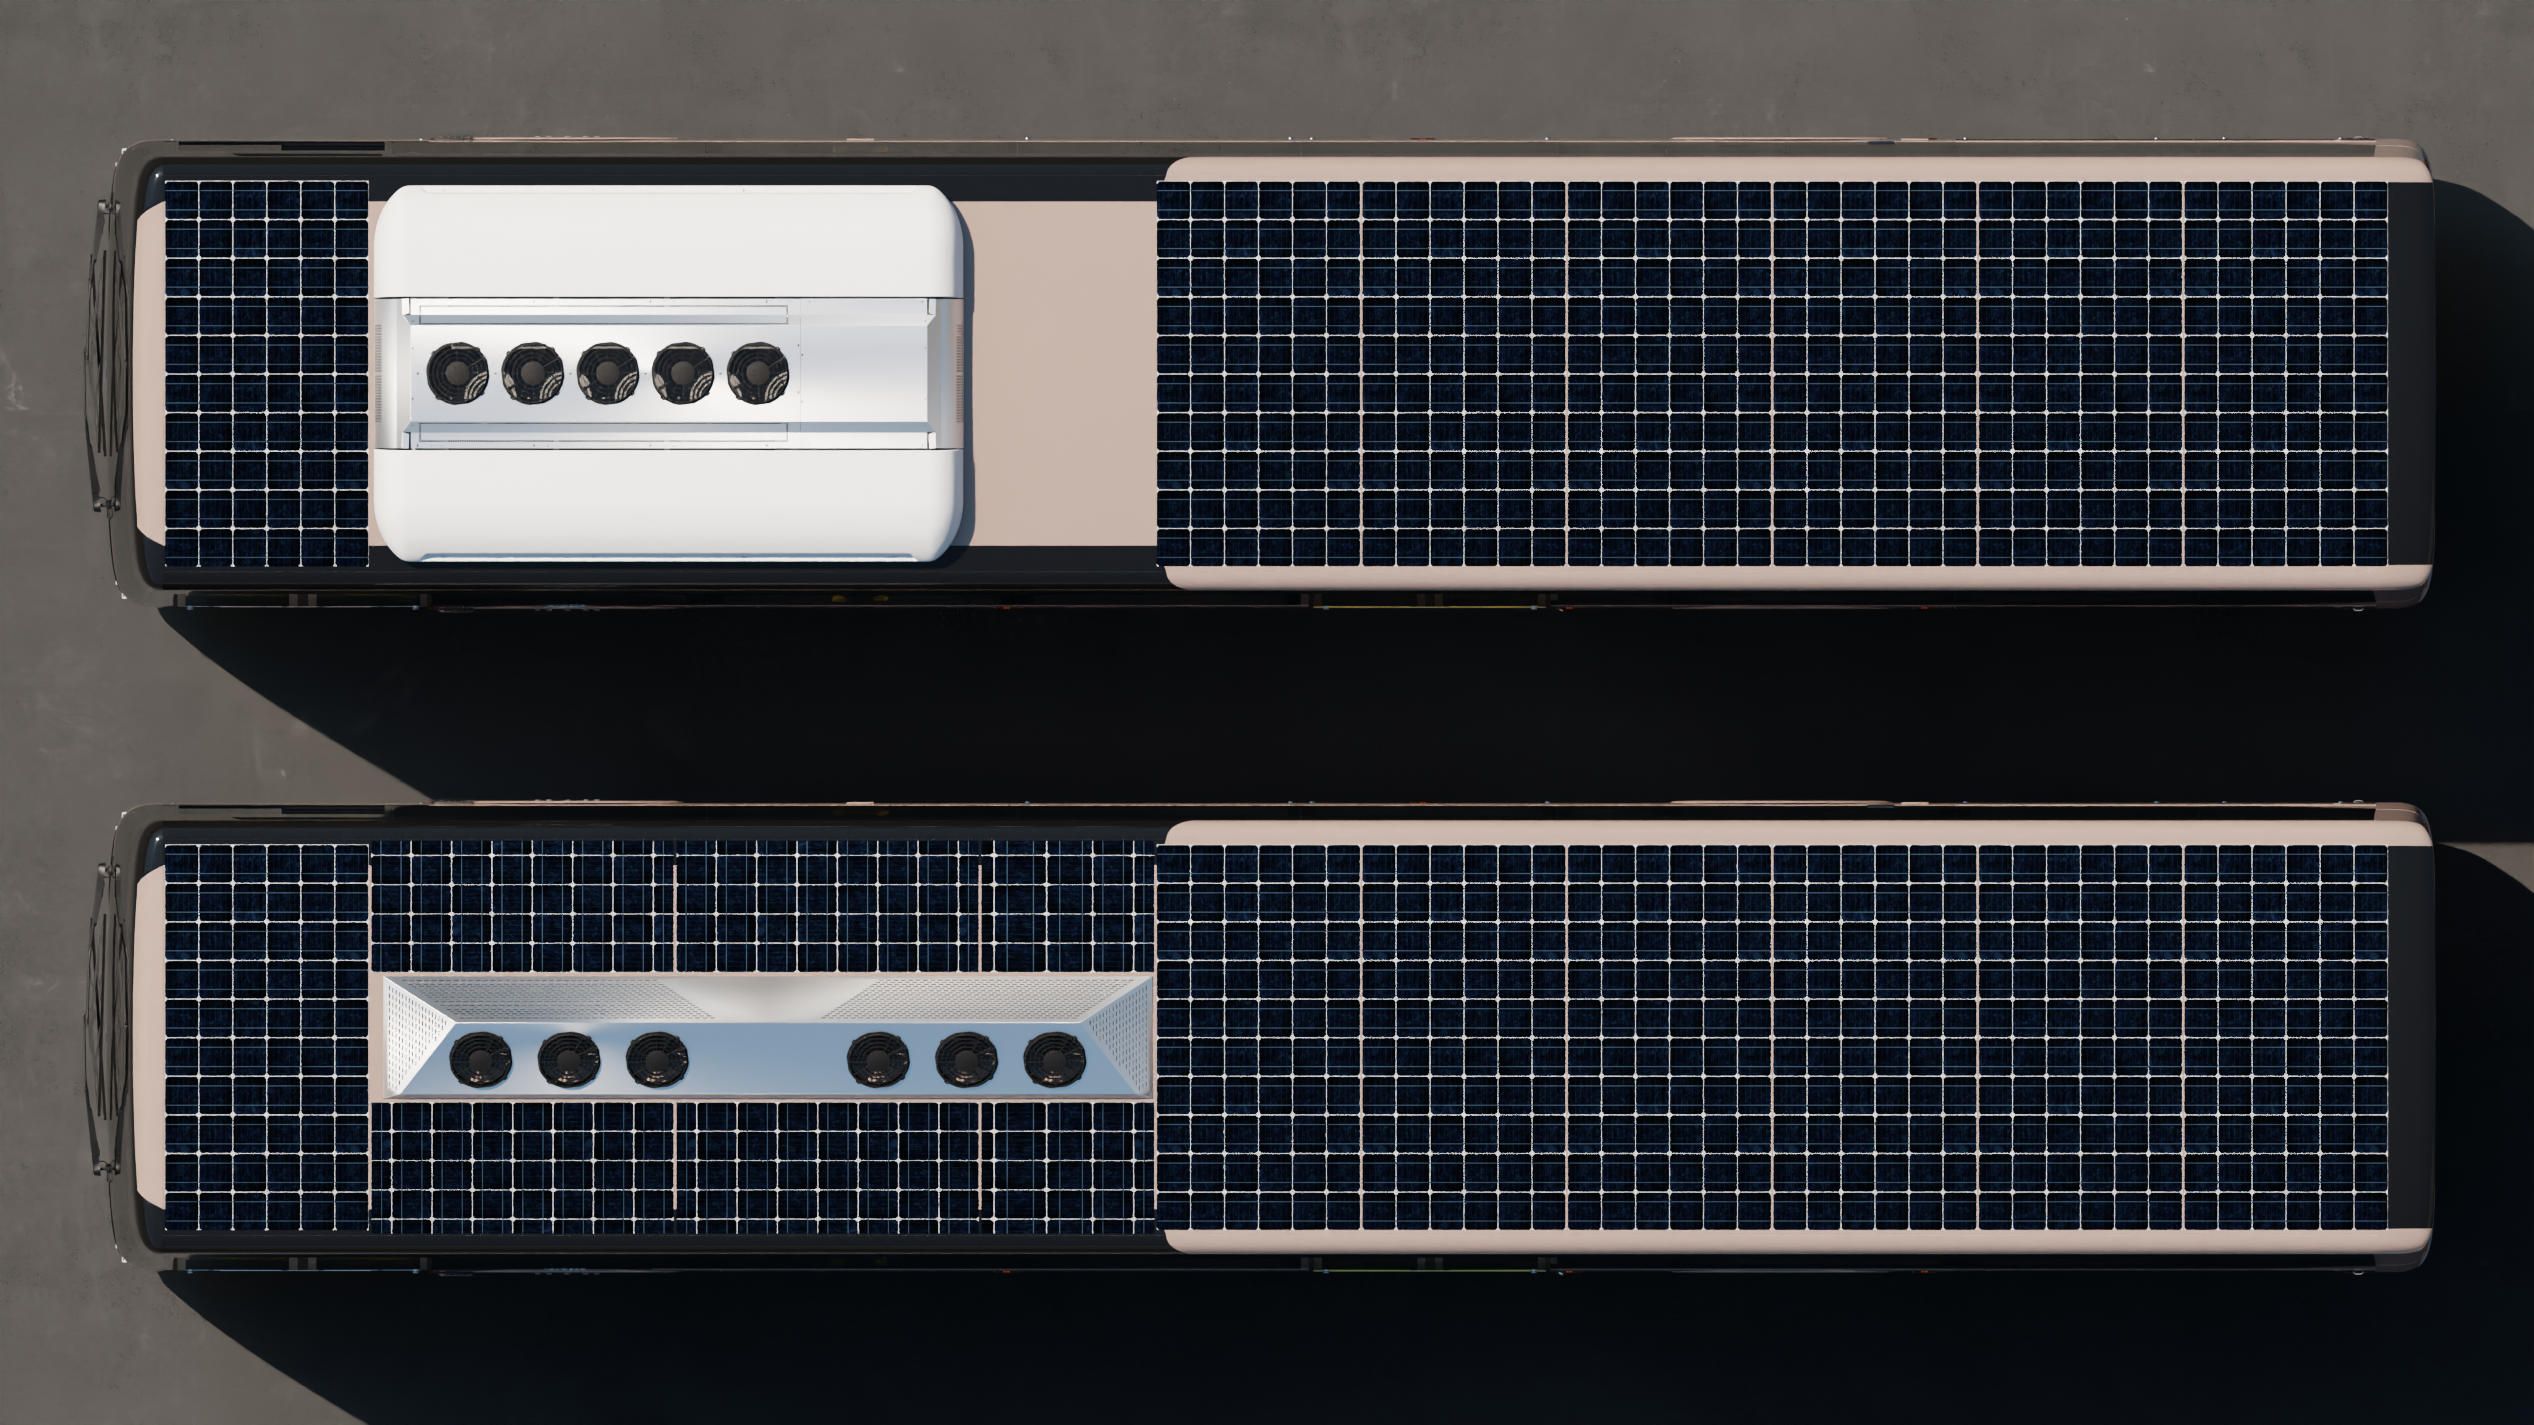
Stage 2 – Custom aircon concept
If we’re really keen to fit as many solar panels on a roof as we can, we’d ought to minimise the space taken up by the airconditioning unit. This would require a customised unit to split the parts that could go off the roof to other places, and leave just the condensator and noisy compressor parts on the roof. While a colleague looked into the internal layout with the lowered components, I primarily focused on the exposed roof components.
There are several ways to arrange the components, but the most viable overall packaging is some variant on a candybar shape. Using approximate geometry for the compressor and condensator tubing and fans, I mocked up eight variations.
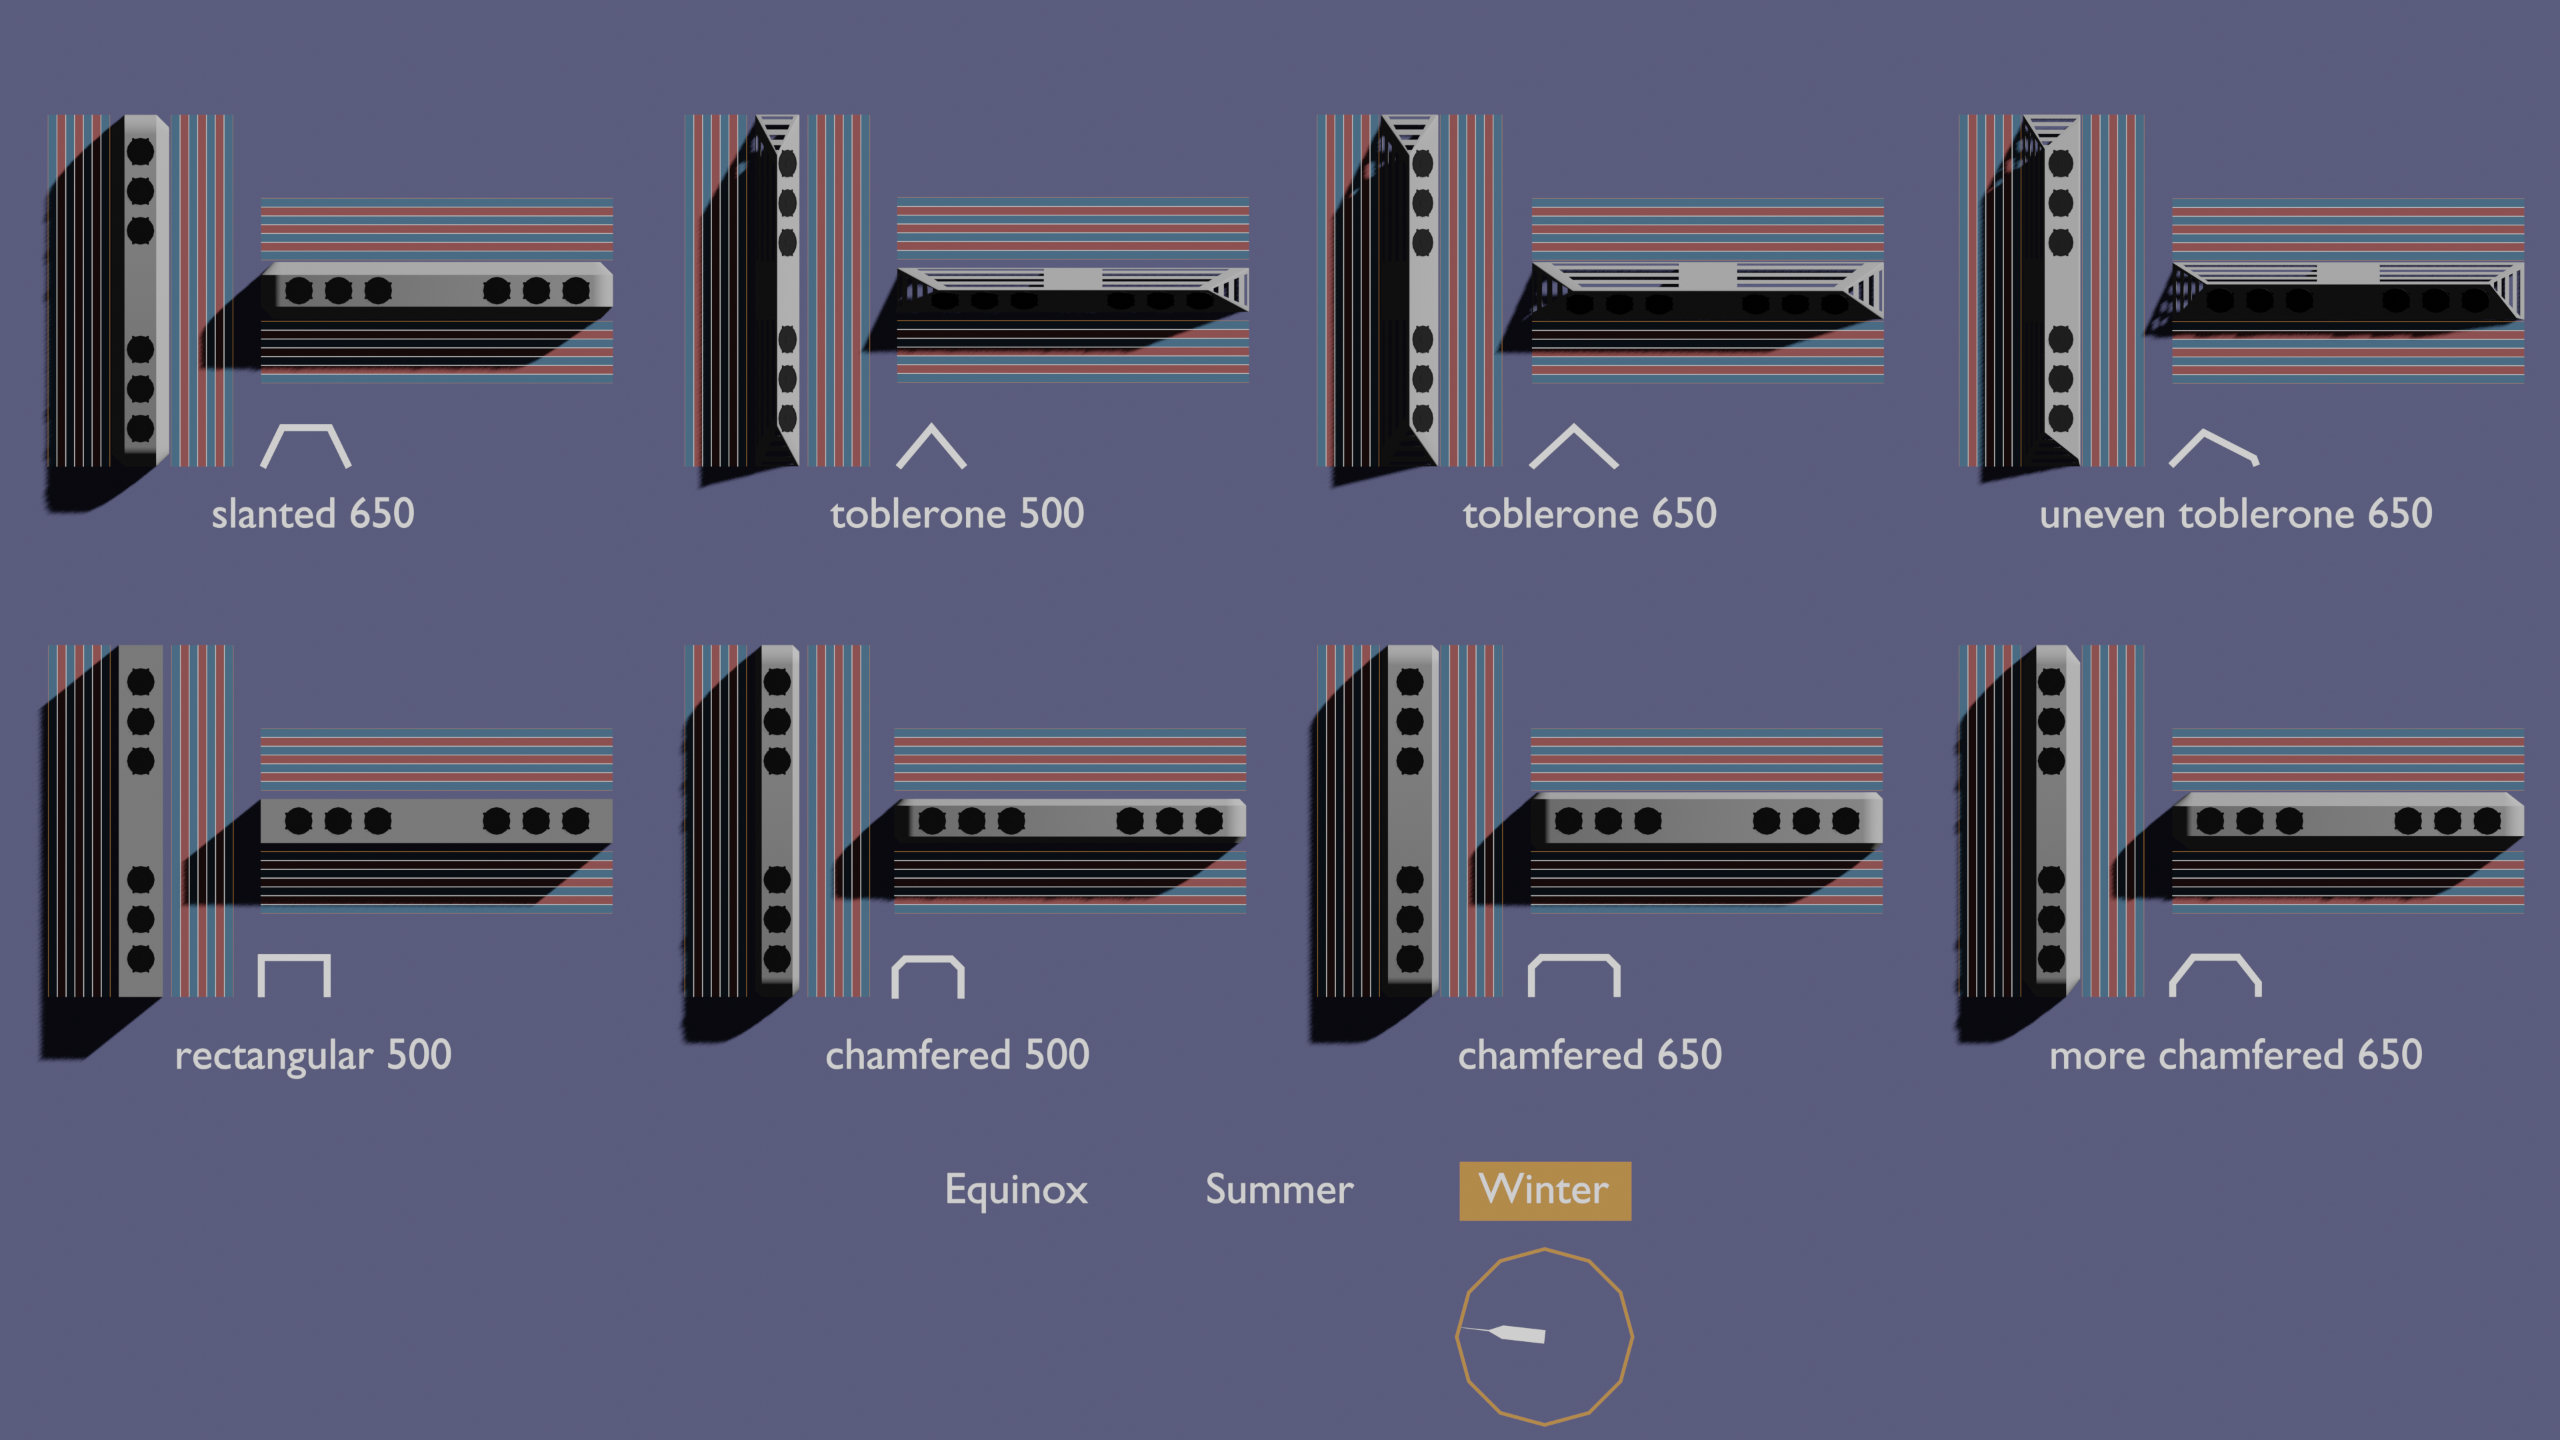
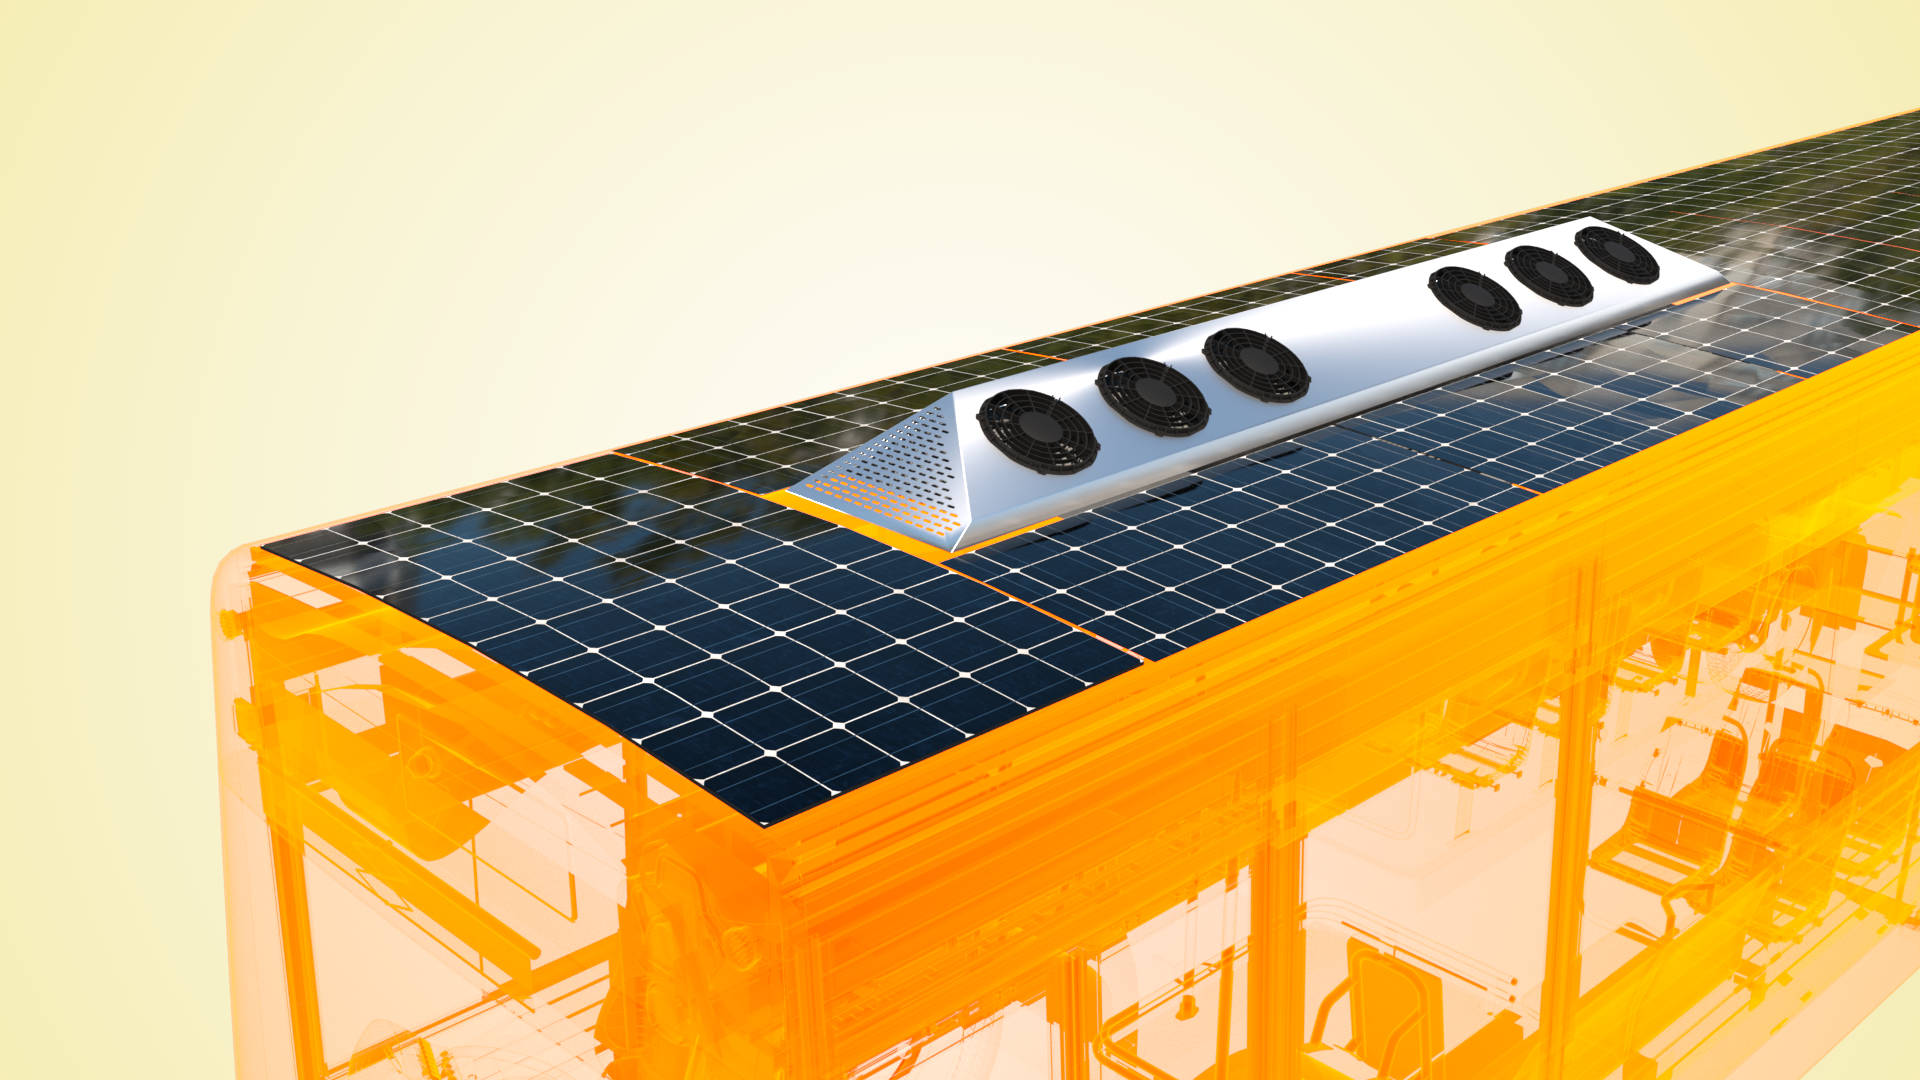
The variations were then compared for their packaging efficiency, manufacturability for low volumes, and importantly, their minimisation of shadowing of surrounding solar panels. Shadows, even on a small part of a solar panel, reduce the power output drastically, so minimising shadows is desirable. A boxy shape would offer efficient packaging but the high walls would throw large shadows at low sun angles. A triangle shape (like a toblerone) would be the opposite. I settled on an ‘uneven toblerone’ shape as the best mix of packaging, fan placement, and shadowing reduction.
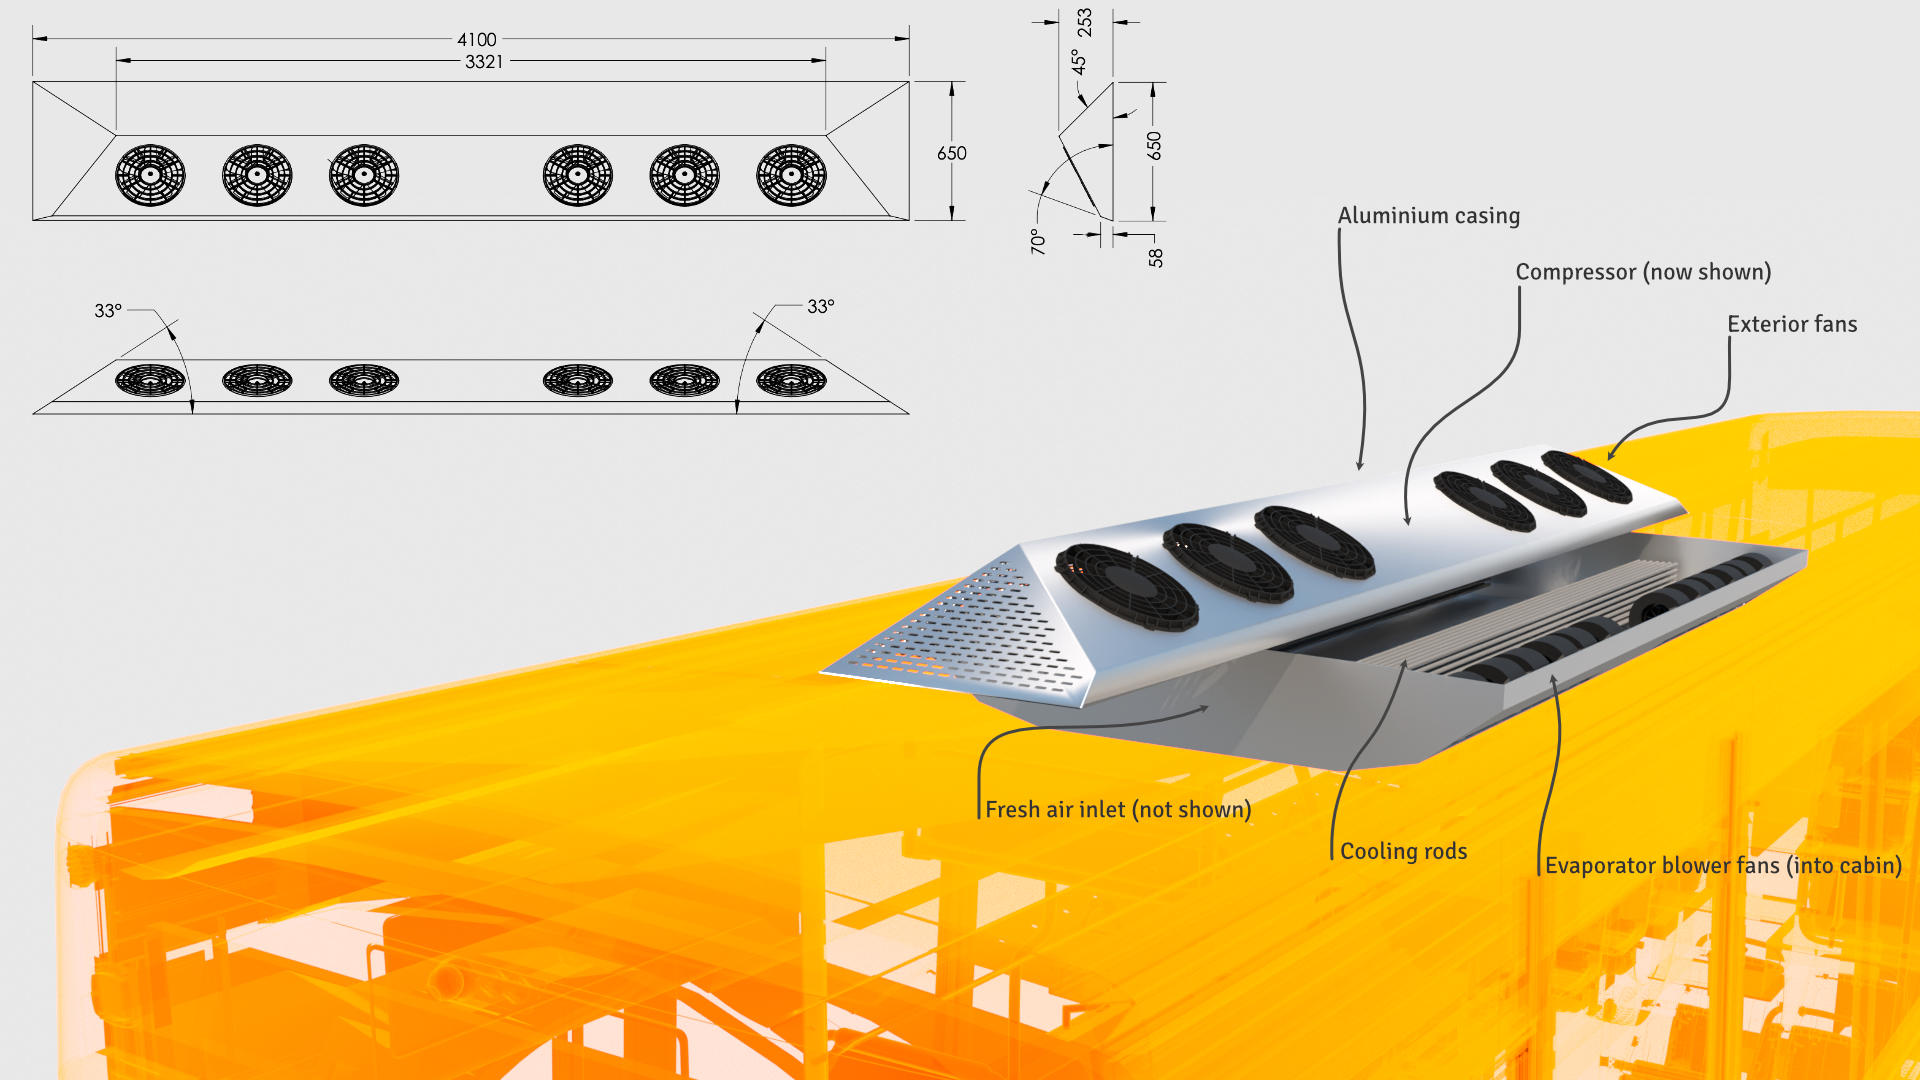
The final design was mocked up in 3D renders and used by executives for promotional purposes. A few draft technical drawings were prepared, but further technical development was slated for the medium-term future. In my view, it is unlikely the energy gains outweigh the potential development costs. Nonetheless, this was a useful exercise to explore design options and stimulate interesting discussions.